[ad_1]
Economists have warned of wealth inequality rising in Great Britain owing to the pandemic after 14 years of relative stability, which has bucked the trend of many other countries where divides have been steadily widening.
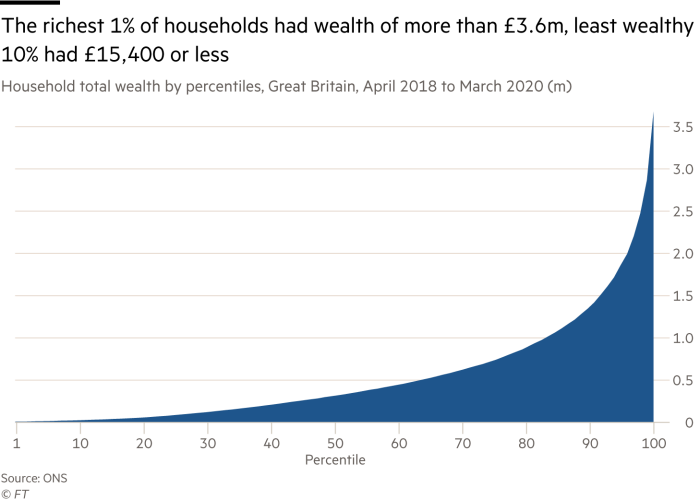
The wealthiest 10 per cent of households owned 43 per cent of all the wealth in Britain between April 2018 to March 2020, data from the Office for National Statistics showed on Friday. In contrast, the bottom half of the population held only 9 per cent.
However, over the past 14 years wealth inequality measured by the Gini coefficient has remained by and large stable, according to the ONS.
This is in contrast with many countries where wealth inequality increased between 2000 and 2019, including in the US, Italy, Russia and China, according to estimates by Credit Suisse. Over that period, wealth inequality also remained largely stable or fell in France and Germany.
The data also revealed that the wealth of the richest 1 per cent of households in Great Britain was more than £3.6 million per household on average, 230 times higher than the £15,400 or less for the least wealthy 10 per cent.

These are “striking findings” said Arun Advani, assistant professor at the University of Warwick, adding the wealth gap had likely been underestimated as “the wealthiest are less likely to respond to the survey”.
Furthermore, wealth derived from the ownership of businesses is not included in the survey, creating a further distortion.
Robert Palmer, executive director at Tax Justice UK, said that even before the coronavirus crisis “it was clear that wealth inequality was entrenched”.
While Krishan Shah, researcher at think-tank Resolution Foundation, noted that “with limited financial resources to protect them from economic shocks, the poorest households were undoubtedly in the worst position heading into the pandemic”.
The latest ONS figures are the most comprehensive set of data on wealth distribution available but do not cover the period of the pandemic.
Separate ONS data released last month showed that total UK wealth increased during the crisis as economists warned of profound consequences for income equality and social mobility.
“Strong growth in global stock markets and in UK house prices has yielded significant gains in the wealth of pension holders and homeowners, who sit in the middle and upper part of the wealth distribution,” said David Sturrock, economist at the Institute for Fiscal Studies think-tank.
He added that much of the savings accumulated during the pandemic had been on the part of higher-income households, while those on lower incomes “have drawn down on their savings and increased debt”.
ONS data showed that the wealthiest top 1 per cent held average household pension assets of around £2m in the two years leading up to March 2020. Whereas the least wealthy 10 per cent only held wealth in physical assets, such as cars and furniture.

Financial wealth, such as that held in stock, for the richest 1 per cent was greater than for the bottom 80 per cent of the population.
The ONS data also revealed striking differences between age groups, with the median wealth of those aged 55 to 65 about 25 times higher than those aged 16 to 24, reflecting differences in property and pension assets.

Median wealth in the south east, the wealthiest region, of £503,400 was about three times higher than the north east, which has the lowest assets with £168,500.
In London, the wealth of an average household was £340,300 — marginally above the national average but well below the wealthiest region.
This reflected the capital having the lowest property ownership rate in the country, low participation in private pensions and decreasing median wealth. It remained the region with the most uneven wealth distribution.
[ad_2]
Source link

