What’s in a name? Would a bundle of financial securities that represent the fractional ownership of some companies by any other moniker perform as sweetly? Apparently not.
People increasingly categorise equities not just by sector or country, but according to “factors” — basically what stock market style they are, and what drives them.
For example, large parts (though not all) of the technology world are “growth” stocks, in that they tend to be more expensive, faster-expanding companies. Energy companies, industrial conglomerates and car manufacturers are generally “value” stocks because they’re cheaper.
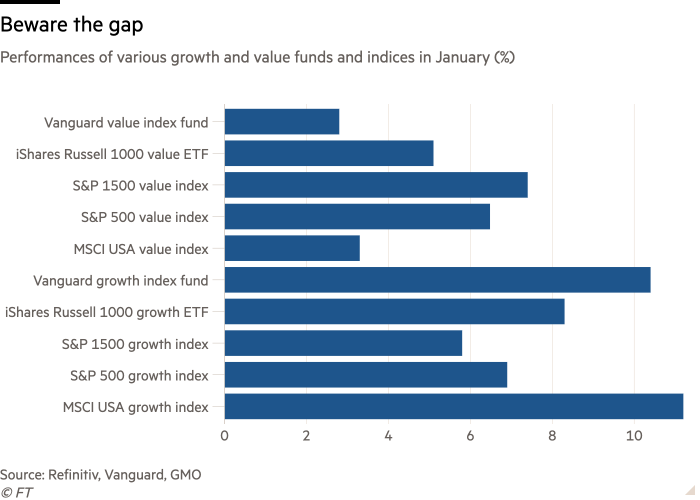
However, how exactly you measure these things can sometimes have a huge effect. Here are the relative January performances of various US value and growth indices and index-tracking funds.

Following Vanguard’s way of slicing and dicing stock market factors (they use CRSP indices), growth outperformed value by 7.6 percentage points last month, while MSCI’s US value and growth indices also diverged markedly (3.3 per cent vs 11.2 per cent respectively). In contrast, the value and growth versions of the blue-chip S&P 500 performed pretty similarly in January.
Perhaps most eye-catchingly, if one uses S&P’s broader stock market benchmark — the S&P 1500 Composite index — then value stocks actually beat growth by 1.6 percentage points.
Discrepancies happen, but January’s divergences looks unusually sharp. Here’s GMO’s asset allocation team — which alerted FTAV to the issue — on the subject:
• After a bruising 2022 for equities globally, Value stocks in the U.S. have become attractive in an absolute sense and worthy of inclusion in one’s portfolio. But the wide range in returns for various Value implementations in January 2023 raises the question, What are “Value” stocks?
• At GMO, we define the Value universe as those stocks that trade at a discount relative to the market based on our assessment of underlying corporate fundamentals. When estimating corporate worth, we
— adjust reported (GAAP) data for metrics like book value and earnings by capitalizing intangible assets and accounting for the impact of share buybacks,
— recognize that higher-quality and faster-growing companies deserve a valuation premium, and
— utilize multiple valuation models to ensure a robust assessment of overall attractiveness.• Index providers take very different approaches, not just relative to GMO’s approach but also relative to each other. The performance of various indices’ Value implementations in January 2023 makes this abundantly clear. Value either outperformed by 1.6% or underperformed by 7.6%, depending on which index you follow.
• Or, have a look at the price-to-earnings ratios and return-on-equity levels. If you are buying Value passively, you could be paying 21x for a 19.5% ROE group of stocks or 25x for a 13% ROE portfolio.
We took out GMO’s plug for one of its own value funds at the end, but for reference it was up 8 per cent in January.
All in all, it’s a good reminder that even honest efforts to try to impose some rigour and order to the chaos of markets often fails because human-made frameworks are inherently subjective as well.
Does that mean that factors are useless? No. As the statistician George Box once quipped, “all models are wrong, but some are useful”. The factor framework is an imperfect, messy but still useful way of looking at markets.


Comments are closed, but trackbacks and pingbacks are open.