

The year 2022 was agonising for US stocks. Not only did they fall excruciatingly far, with a 20 per cent retreat in the S&P 500 over the 12 months. But they also dropped in a relentless way.
There was never any capitulation, the cleansing fire of panic selling that makes room for the next rally. Instead, stocks clip-clopped down 1 to 2 per cent at a time — it was orderly but painful.
Now we are seeing the same process in reverse. In 2023, stocks are up 20 per cent, all but erasing the past year’s losses and coming close to the S&P’s pandemic summit.
And this year’s buying, like last year’s selling, has not come all at once. It has materialised in three phases. First, January and February saw a sudden rush to risky assets. Next, February until May were the worry months, when investors fretted over everything from bank failures to recession. Finally, since May, we have seen a transition from fear to greed, helped by good economic news and all the excitement surrounding artificial intelligence.
Bears are in retreat today, and investors increasingly think a new bull market is being born. Yet full-throated bullishness is hard to find on Wall Street. “Time to get some worry beads?” asks Ed Yardeni, the veteran strategist, despite his call that the market will rise another 15 per cent this year.
Many rallies inspire doubt at first, but this one is seen as especially uncertain. Inflation is still a threat. Interest rates are still rising. US valuations are far from cheap and recession risk, though it has dwindled, remains serious. Corporate profits peaked a year ago and may struggle to grow again. Most importantly, equities now face real competition from bonds and cash. Can the budding US stock rally survive?
Unhedged, the FT’s New York-based markets newsletter, tries to work out where US equities are heading for Money readers — drawing on conversations with market experts and our own daily notes.

The three phases
To understand where stocks are now, it helps to see where they’ve been.
As the year began, investors took on risk, and lots of it. The S&P’s 10 per cent rise through early February was beaten by the tech-heavy Nasdaq, which rose 17 per cent. Big tech led the way, rising on average 33 per cent. Apple alone made up 14 per cent of the S&P’s gains through early February.
Mighty tech was joined by lowly junk. That is to say: crypto, meme stocks, special purpose acquisition companies and profitless tech stocks all posted double-digit percentage gains. It was a “flight to shite,” as the FT’s Robin Wigglesworth memorably called it.
One driver was a steady flow of encouraging economic data. Inflation was falling, economic growth was cooling without collapsing. Many investors saw falling rates — or at least an end to rising rates — in the not too distant future. That dovish rates outlook helped the riskiest investments.
A liquidity gusher was also at work. Think of liquidity as a pool of cash seeking a home in investable assets. As liquidity rises, often from central bank injections, demand for investable assets rises. Yet if the supply of investable assets does not also rise, sponging up the extra liquidity, the extra cash pushes asset prices higher. And investors, short of options, are nudged further out on the risk spectrum.
And liquidity certainly rose. One measure of global US dollar liquidity, tracked by Michael Howell of CrossBorder Capital, shot up 29 per cent between October and February.
This couldn’t last, and didn’t. As widely predicted, stocks lost momentum. Thus began phase two: consolidation and worry. Between mid-February and the end of May, the S&P was flat to down. The reasons will sound familiar: sticky inflation, higher and higher interest rates, the long and variable lags of monetary policy, uncertainty around the US debt ceiling, weakening corporate profits and recession fears.
In the same period Silicon Valley Bank collapsed, a product of poor rate-risk management, slack oversight and depositor concentration. Two other US banks followed, plus one noted Swiss lender. Suddenly, US investors had a new anxiety: a credit squeeze. Turn on the CNBC television channel around mid-March and you’d hear things like: “The highest probability of a crash or a drawdown in the next 60 days since Covid.”
Bank lending standards had been growing stricter even before the SVB shock, thanks to tighter monetary policy. But the bank’s abrupt failure, and the contagion that followed, suggested that worse lay ahead. Smaller banks would have to protect themselves, meaning lending falling off a cliff. Worse, small and regional banks make the bulk of commercial real estate (CRE) loans, a sector which, because of rising rates and remote work, was going through a violent price adjustment, especially in offices.
Some imagined a death spiral in commercial property. Deteriorating CRE would saddle regional banks with losses, which would cease lending to any CRE up for refinancing, worsening the property downturn. Bonds soared, with the two-year yield (which moves inversely to price) diving more than a full percentage point. One top Wall Street economist even argued that the Fed would have to enact emergency rate cuts to shore up the financial system.
Four months on, hindsight reveals this as too alarmist. The Fed successfully rolled out liquidity backstops that halted the banking panic. Though lending standards are still tightening, a seize-up in credit conditions never came. Meanwhile, CRE appears diverse, slow-moving and flexible enough to avoid any kind of death spiral. Unlike Europe and Asia, “the US lending market in real estate is the most diverse and dynamic in the world,” says Bryan McDonnell, head of US debt at PGIM Real Estate. A deep correction to office valuations is happening, but the timescale looks more like five to seven years, not a few months, he adds.
However, it is worth remembering how afraid investors were back then, because it set expectations low. Stocks did not collapse, but struggled to find traction. The market was immobile. Between the start of April and mid-May, the S&P rose or fell more than 1 per cent just six times — and there were zero days with a 2 per cent move in any direction. Discretionary investors, who judge when to buy or sell, were leery of risk assets. In their stead, algorithmic traders at so-called volatility control funds — which buy when markets are quiescent — became a crucial source of equity demand.
That brings us to the transition from fear to greed. It began in a curiously lopsided fashion. By mid-June, big tech stocks (Meta, Microsoft, Apple, Google, Nvidia, Tesla and Amazon, later termed the “magnificent seven”) made up all of the S&P’s 15 per cent gains for the year. And it wasn’t as if these gains were pure froth. AI excitement swept the market, egged on by the star power of ChatGPT and an exceptional earnings forecast from AI-focused chipmaker Nvidia.
In the weeks since, the rally has broadened. It’s full-fledged risk-on mode: sentiment is improving, discretionary investors are positioning more aggressively, meme stocks are jumping and a wide range of stocks are rising, even regional banks. As Alex Chaloff of Bernstein Private Wealth Management said in the FT this week: “The market rally has really reminded people why it’s just so hard to walk away from equities.”
Thank economic resilience. Fast falling inflation and strong consumer spending have made “soft landing” the talk of Wall Street. Bearish economists are starting to write mea culpas for their recession calls, which now look premature, if not plain wrong.
Jason DeSena Trennert, managing partner at New York’s Strategas Research Partners and a longtime recessionista, sums it up in a recent note: “As Falstaff said, ‘discretion is the better part of valour’. There are times as a forecaster when it’s best to stop the bleeding, take a clean sheet of paper, and reassess.”
Stocks, meet bonds
So if all’s on the up and up, is it time to buy US stocks? If you are young or are otherwise investing for the long term, it is almost never a bad time. For almost everyone else, they are hard to recommend. One must ask: why own stocks when a risk-free two-year US Treasury will pay me 5 per cent to hold it and do nothing?

Consider the equity risk premium (ERP), the additional dollop of returns that stock investors earn over bonds. A lower ERP suggests investors are thinly compensated for taking on equity risk. By one measure (see chart above), the premium on the S&P is the lowest in a decade.
Other valuation measures likewise suggest stocks are stretched. At 20, the S&P’s 12-month forward price/earnings ratio is 15 per cent above its 30-year average. One reason is that the index’s recent gains have come from expansion in the valuation multiple investors assign to US stocks, not from organic growth in earnings.
Earnings have shown resilience, in line with overall growth, but a soft landing requires muted demand to curb inflation; it is not a recipe for a roaring profits boom. The expansion of the multiple is a flimsy basis for a rally, because it is vulnerable to sudden shifts in investor sentiment. And such a shift seems plausible, given markets’ present exuberance.
As JPMorgan strategist Marko Kolanovic writes: “Equity valuations (multiples) are not pricing a soft landing, but rather a continued expansion and simultaneous monetary easing . . . Multiples appear too high.”
This is not an argument that stocks will crash, but rather that risk-adjusted returns for mainline large cap stocks may struggle to beat what can be earned in fixed income or money markets.
Investors seeking risk can now do it in bonds. Investment-grade debt now yields 5 to 6 per cent with modest default risk. High-yield (“junk”) bonds pay 8 per cent, and the lowest-quality triple-C junk yields 13 per cent. True, these yields don’t look historically high when benchmarked to Treasuries, but the absolute yield remains “reasonably high” and borrowers’ earnings have shown more resilience than expected, argues Felipe Villarroel, portfolio manager at Vontobel Asset Management.
Moreover, company quality in the high-yield universe has improved over the past decade or so, now including the likes of Ford and Delta Air Lines.
The biggest danger to bonds is inflation re-accelerating, though this will hurt stocks, too, by forcing rates higher and raising recession odds once again. Until inflation fears fade fully, no asset class will glisten. But prospective US stock investors may want to wait, and bonds seem as good a place as any to do so.
Take a look at small-caps
Sceptics argue that excess labour demand means steady wage growth, which tends to boost consumption and therefore inflation. Stubborn inflation will egg on the Fed to raise rates higher, bringing down inflation only by engineering a recession.
So far, though, this sort of scepticism has not been borne out. The truth is that the economic data has moved in the direction of the soft-landing believers.
And investors seem willing to buy on good economic news. In recent weeks, resilient economic data pushed up stocks and tightened investment grade credit spreads. This, points out Yuri Seliger of Bank of America, is unlike the string of strong economic data in February, marked by wider investment-grade spreads (a bearish sign) and falling stocks. The market sees a less painful growth/inflation trade-off than it once did.
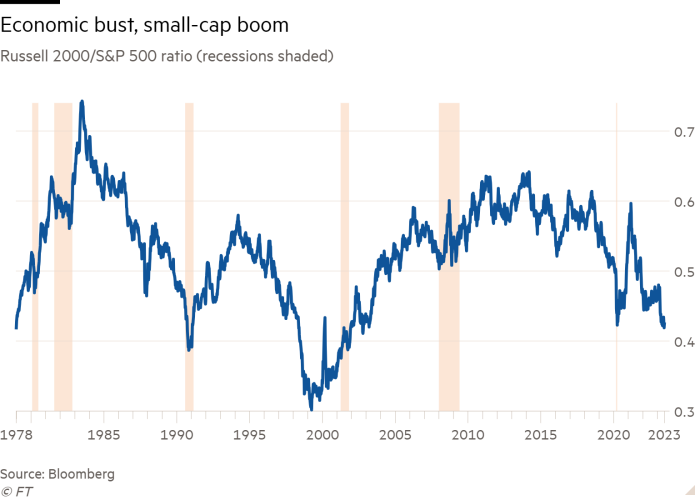
So for investors on the hunt for a trade, here’s one: small-caps. As my colleague Robert Armstrong and I wrote in Unhedged last month, the case for them starts with valuations. The S&P 500 is expensive no matter how you cut it. But not the humble Russell 2000. Valuations for this small-cap index are better assessed by price/book ratio than standard forward price/earnings, Goldman Sachs analysts said in a recent note, pointing out that smaller companies may not be profitable or have reliable analyst earnings forecasts. On a price/book basis, then, the Russell looks reasonably priced.

Next, consider the biggest risk to small-caps: the business cycle. Compared with large-caps, small-caps’ weaker balance sheets and more volatile revenues expose them to cyclical vicissitudes. Traditionally, that has meant small-caps sag late into a cycle, when investors flee to quality, and then rebound once recession ends. Early cycle is when you want to own the Russell.
Since Unhedged wrote on small-caps last month, they have rallied 7 per cent, as investors increasingly bet on a soft landing. The bet now is that there is still further for small-caps to run as the soft landing moves from growing hope to market reality.
Even in a soft landing, however, there are risks to small-caps. One is that rates stay higher for longer. No recession means no reason to cut rates, and nearly a third of Russell 2000 debt is floating rate (versus 6 per cent for the S&P), notes Goldman. Higher debt costs would pinch small-caps’ thinner margins, denting performance.
Another risk is sector composition. Todd Sohn of Strategas points out that “boom or bust biotech” is also over-represented in the Russell, and looks mired in a bust phase. Also, investors might want to think carefully before owning small-cap banks right now, and they make up 7 per cent of the Russell but only 3 per cent of the S&P.
Both of these problems could be addressed by not buying the whole index and instead by picking a basket of low-leverage stocks, avoiding biotech and banks. Sohn suggests tilting towards small-cap industrials, the largest sector in the Russell and one chiefly exposed to growth.
Comments are closed, but trackbacks and pingbacks are open.