[ad_1]
Sponsored by

Mid-caps stocks have been called the forgotten asset class. Stuck between typically more popular large-cap stocks and the potential upside of small caps, the appeal of mid-caps is often overlooked. Similarly, dividend investors can under-appreciate the “sweet spot” of high quality mid-cap stocks that have consistently grown their dividends. But make no mistake, mid-cap Dividend Aristocrats® represent a potentially compelling investment opportunity, and may warrant consideration when constructing portfolios.
The Case for Mid-Cap Stocks
The mighty mid-caps…
The forgotten asset class…
The sweet spot…
All of these have been used to characterize mid-cap stocks over the years. Whatever you call them, investors would be wise to understand their appeal. Middle-size companies generally carry the unique position of having mature and proven business models, while also still having ample room for growth. In fact, mid-cap stocks have performed exceptionally well since Standard & Poor’s introduced the S&P MidCap 400 index in 1991.
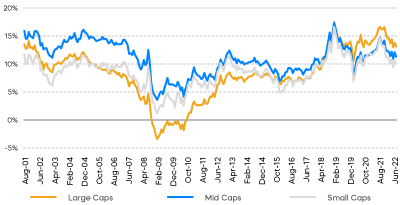
The S&P MidCap 400 has delivered greater nominal and risk-adjusted returns compared to the large-cap S&P 500 and small-cap Russell 2000 Index.
- Mid-cap stocks also consistently outperformed over longer periods, delivering better returns than large and small caps in 84% of the rolling 10-year return periods since 1991.
As of 7/30/2022, mid-cap stocks represent 20% of total U.S. market capitalization, according to Morningstar. However, despite their long-term outperformance, they represent just 11% of domestic mutual fund and ETF assets.
Mid-Cap Stocks Have Had Consistently Higher Rolling 10-Year Returns
Source: Morningstar, data from 9/1/91‒8/31/22.
What Makes a Mid-Cap Aristocrat?
The Dividend Aristocrat brand is well known to investors who seek to invest in high-quality companies with the longest records of consistent dividend growth. Many investors intuitively associate dividends with large-cap stocks, particularly from companies with prominent brands that make products they consume regularly. Household large-cap names like Coca-Cola, Procter & Gamble, and Johnson & Johnson, have been growing their dividends for over 50 consecutive years.
What’s often missed, however, is that similar dividend longevity also exists in mid-cap stocks. While their names may be less familiar, their dividend records are often no less impressive.
The S&P MidCap Dividend Aristocrats Index is made up of a distinguished group of 48 companies that have grown their dividends for at least 15 consecutive years. Over half of them have grown their dividends for more than 25 consecutive years. Not surprisingly, they generally come with attributes of quality that investors have come to expect:
- Durable competitive advantages, solid fundamentals, and management teams that are committed to returning capital to shareholders.
- Higher gross and net profit margins than the broader index, with more consistent levels of earnings growth through the market’s ups and downs.
- Lower levels of debt than the broader S&P MidCap 400.
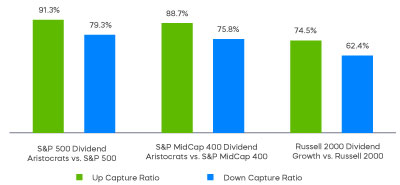
Since its inception in 2015, the S&P MidCap 400 Dividend Aristocrats Index has outperformed the broader S&P MidCap 400 by 167 basis points annualized, with lower levels of volatility. The mid-cap Dividend Aristocrats have also demonstrated a history of weathering market turbulence over time. They’ve done so by delivering most of the market’s upside in rising markets with considerably less of the downside in falling ones—a valuable feature in times of uncertainty.
Mid-Cap Dividend Aristocrats Have Shown Superior Up/Down Returns Capture
Source: Morningstar, data as of 8/31/2022. Index returns are for illustrative purposes only and do not reflect any management fees, transaction costs or expenses. Indexes are unmanaged and one cannot invest directly in an index. Past performance does not guarantee future results. “Up capture ratio” measures the performance of a fund or index relative to a benchmark when that benchmark has risen. Likewise, “down capture ratio” measures performance during periods when the benchmark has declined. Ratios are calculated by dividing monthly returns for the fund’s index by the monthly returns of the primary index during the stated time period and multiplying that factor by 100.
Why Mid-Cap Dividend Aristocrats Now?
We believe the S&P MidCap 400 Dividend Aristocrats may be well positioned in the current market based on a combination of factors.
- They are attractively priced, particularly relative to large caps. With a trailing 12-month price-to-earnings ratio of 15.58, they are trading below their recent averages, and at approximately 84% of S&P 500 levels. On a price-to-book basis, they are trading at approximately 60% of the value of large caps (as of 1/9/23).
- Mid-cap Dividend Aristocrats are expected to deliver faster levels of earnings growth. For calendar year 2022, analysts expect them to deliver earnings growth of 17.5%, well above the 7.6% rate of the S&P 500 (as of 9/9/2022).
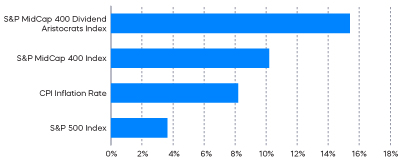
- High inflation levels have put a premium on finding durable and growing income streams. The mid-cap Dividend Aristocrats grew distributions at over 15% in 2021, a level above those of large caps and recent inflation levels.
Mid-Cap Dividend Aristocrats’ Dividend Growth Rates Can Help Combat Inflation
Source: S&P and Bloomberg, data from 1/1/2021-12/31/2021. The Consumer Price Index is the un-adjusted 12 months ended Mar 2022. It measures the change in prices paid by consumers for goods and services.
The Takeaway
Despite struggling recently, mid-cap stocks have delivered impressive and consistent levels of outperformance for decades. Although often overlooked, the S&P MidCap 400 Dividend Aristocrats—an elite group of mid-cap companies—have produced impressive levels and longevity of dividend growth. Since its inception the S&P MidCap 400 Dividend Aristocrats Index has outperformed the S&P MidCap Index and represents a potentially compelling investment opportunity. This opportunity is based on more favorable valuations as compared to large caps, robust earnings growth, and attractive levels of dividend growth.
Important Information
Data provided by Morningstar, FactSet, and Bloomberg. All data points are as of 8/31/2022, unless otherwise noted.
This is not intended to be investment advice. Any forward-looking statements herein are based on expectations of ProShare Advisors LLC at this time. ProShare Advisors LLC undertakes no duty to update or revise any forward-looking statements, whether as a result of new information, future events or otherwise.
Investing is currently subject to additional risks and uncertainties related to COVID-19, including general economic, market and business conditions; changes in laws or regulations or other actions made by governmental authorities or regulatory bodies; and world economic and political developments.
Index information does not reflect any management fees, transaction costs or expenses. Indexes are unmanaged, and one cannot invest directly in an index.
Carefully consider the investment objectives, risks, charges and expenses of ProShares before investing. This and other information can be found in their summary and full prospectuses. Read them carefully before investing. Obtain them from your financial professional or visit ProShares.com.
The “S&P 500,” “S&P MidCap 400” and “S&P MidCap 400® Dividend Aristocrats® Index” are products of S&P Dow Jones Indices LLC and its affiliates and have been licensed for use by ProShares. “S&P®” is a registered trademark of Standard & Poor’s Financial Services LLC (“S&P”) and “Dow Jones®” is a registered trademark of Dow Jones Trademark Holdings LLC (“Dow Jones”) and have been licensed for use by S&P Dow Jones Indices LLC and its affiliates. The “Russell 2000®,” “Russell 2000® Dividend Growth Index” and “Russell®” are trademarks of Russell Investment Group (“Russell”) and have been licensed for use by ProShares. ProShares have not been passed on by these entities and their affiliates as to their legality or suitability. ProShares based on these indexes are not sponsored, endorsed, sold or promoted by these entities and their affiliates, and they make no representation regarding the advisability of investing in ProShares. THESE ENTITIES AND THEIR AFFILIATES MAKE NO WARRANTIES AND BEAR NO LIABILITY WITH RESPECT TO PROSHARES.
[ad_2]
Source link

