[ad_1]
The dramatic growth of target date and “asset allocation” funds appears to be driving sharp end-of-quarter rallies whenever the US stock market wobbles, data show.
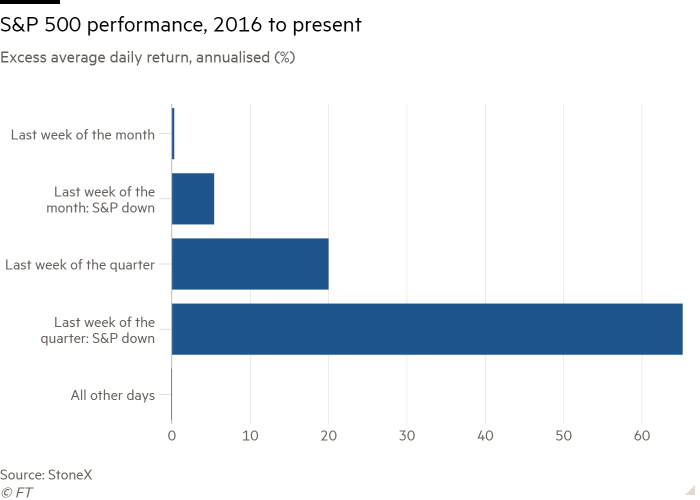
In the past six years, the S&P 500 index has risen at an average annualised rate of 80 per cent in the final week of quarters in which the index has fallen, according to analysis by Vincent Deluard, global macro strategist at StoneX, a broker.
“Stocks have rallied by an absurd 80.6 per cent per annum in the last week of the quarter during down quarters since 2016,” said Deluard, an example of “miraculous seasonal patterns in the passive era”.
The index also outperformed in the final week of any month in which the market has been down, adding to evidence that the once commonly observed “momentum” effect in markets appears to have broken down.
Deluard pointed the finger at target date funds, and similar asset allocation-based mutual and exchange traded funds, which are inherently contrarian.
These funds aim to hold a fixed proportion of equities and bonds. This means that if equities underperform bonds in a given period, funds must rotate into equities at the end of it, in order to bring their portfolios back into line with their target allocation. The opposite occurs if stocks have beaten bonds.
“What has gone down must be bought and what has gone up must be sold,” Deluard said.
This rebalancing period is typically every month, quarter or half-year.
These dates have become ever more critical as the volume of assets in US target date funds has jumped from less than $8bn in 2000 to nearly $3tn today as they have become the most common default investment option in 401k defined contribution pension plans. A wide array of asset allocation ETFs also follow the same investment principle.
Deluard’s analysis suggests this has reversed some commonly observed patterns in stock markets.
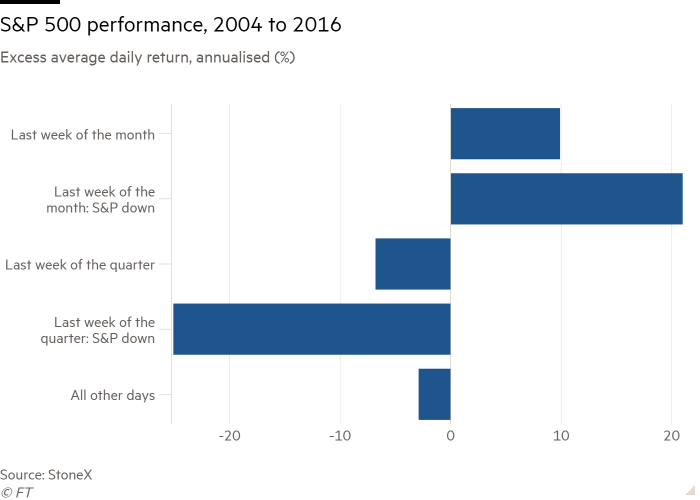
Between 1945 and 2004, the S&P 500 typically performed very poorly in the final week of months and quarters in which the index had fallen.

The pattern in performance is an example of the “momentum” effect, the tendency for stocks that have underperformed in one period to do so again in the following period and vice versa for outperformers.
Between 2004 and 2016 this momentum effect continued in the final week of quarters in which the market was down, but reversed in the final week of down months. Since 2016, Deluard’s data suggest it has also reversed at the quarterly level.

“Academics have documented that stocks’ tend to display positive momentum because most retail investors and commodity-traded advisers chase trends,” he said.
“The pattern changed in the infancy of the target date fund industry. The pattern has fully inverted since 2016.”
Admittedly, the quarterly data for the latter time period is based on just five market sell-offs, so is a small sample size from which to draw any firm conclusions.

However, other data points add some credence. Firstly, calendar patterns for commodities and bitcoin — two assets that are not held by target date or asset allocation funds — have not altered. For both of these, returns still tend to be particularly poor in the final weeks of both down months and down quarters.
Secondly, for most of the post-1945 period, the quarterly returns of the S&P 500 tended to be correlated with those of the previous and subsequent quarters. This serial correlation has now turned negative.

In reality, any profound change in market dynamics may be driven by a wider pool of assets than target date and asset allocations funds.
Nevertheless, Deluard argued that his analysis, if accurate, had several important implications.
One is that quantitative hedge funds are likely to exploit this anomaly by front running it, a process that would transfer wealth from small pension savers to short-term arbitrageurs.
Secondly, he believed the likelihood of target date funds buying the dip at the end of a down quarter has encouraged risk taking and stopped pricey market valuations from normalising.
Thirdly, Deluard argued it increased the “wealth effect”, in both directions. For instance, with the US Federal Reserve now raising interest rates, bond prices may fall. If so, this would drive rebalancing flows out of equities, potentially generating losses in both asset classes simultaneously.
Dave Nadig, financial futurist at ETF Trends, believed target date funds “get a little bit too much emphasis”, in Deluard’s analysis, but pointed out that even if target date funds were largely responsible for the phenomenon it would not affect their popularity.
“Investors like TDFs because they work. The average mid-career investor in a TDF is much better diversified, at much lower fees, with much better expected outcomes, than if they were simply doing it all on their own,” he said.
Ben Johnson, director of global ETF research at Morningstar, was more outspoken.
“As far as I can tell, the only thing [Deluard] hasn’t pinned on target date funds is climate change,” Johnson said.
“And the only thing we can say for certain about low-cost, target date index funds is that they are one of the best options available to investors saving for retirement.”

Click here to visit the ETF Hub
[ad_2]
Source link

