

Global broad regional equity ETFs gathered $17 billion of net ETF inflows in January. The sub-category of ETFs consists of market-cap weighted equity ETFs domiciled in multiple countries. The most popular of these ETFs, according to our data, was $4 billion iShares MSCI Kokusai ETF (TO), which invests in developed markets ex-Japan. In late January, 73% of assets were invested in the U.S. companies, but the fund was partially diversified to the United Kingdom (5%), Canada (4%), France (4%), Switzerland (3%), etc. While CFRA does not know what specifically contributed to the sizable inflows for TOK in January, we think the ETF was likely purchased by a large Japanese institutional investor seeking diversified equity exposure to avoid a home bias.
Vanguard FTSE Developed Markets ETF (VEA) and iShares Core MSCI EAFE ETF (IEFA) gathered $2.2 billion and $1.8 billion, respectively, in January to reach $108 billion and $102 billion in assets. As the sixth and seventh largest U.S.-listed ETFs and the biggest to invest internationally, VEA and IEFA are go-to funds for gaining non-U.S. exposure. While there are slight differences in fees—VEA charges a 0.05% expense ratio that is two basis points less than IEFA—the performance gap between the funds is driven primarily by the markets they provide exposure to. VEA outperformed IEFA by 35 basis points in the three-year annualized period ended Jan. 31.
IEFA has more exposure to Japan (23% of assets) and the U.K. (16%) than VEA but does not own stakes in Canada or South Korea. While the acronym EAFE has become synonymous with developed international markets, the MSCI index tracked by IEFA warrants some scrutiny. MSCI classifies South Korea to be an emerging market and not a developed one the way FTSE Russell, the index firm behind VEA does. As a result, IEFA does not own shares of companies like Samsung Electronics, which is VEA’s second largest recent position and contributes heavily to its 5% of assets country stake. Meanwhile, VEA’s third largest country exposure is Canada (9.5% of year-end assets), but this country is not a part of the EAFE region and not part of IEFA.
Figure 1: Country Exposure of Popular Developed International Equity ETFs (% of assets)
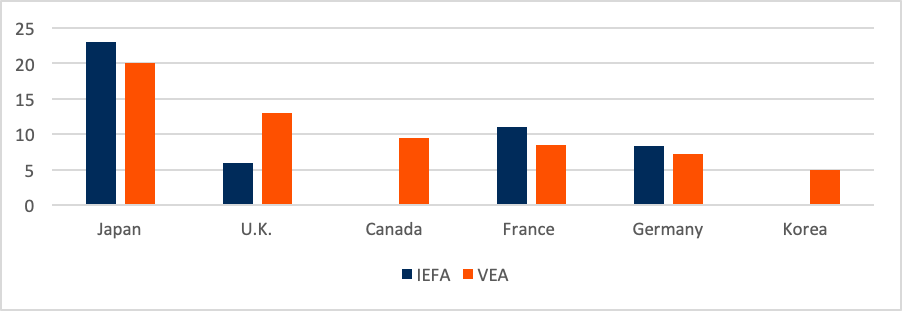
CFRA ETF Data. As of January 28, 2021, for IEFA and December 31, 2021, for VEA.
Conclusion
Despite its slight underperformance over the last three years, CFRA believes there is a greater likelihood of IEFA outperforming VEA and the broader global equity ETF category over the next nine months. Based on the holdings and performance record, we see higher reward potential for IEFA. Even more importantly, investors seeking exposure to developed equity markets need to look inside a fund and not just at its name, expense ratio or net inflows.
Todd Rosenbluth is the director of ETF and mutual fund research at CFRA. Learn more about CFRA’s ETF research here.
Comments are closed, but trackbacks and pingbacks are open.