[ad_1]
Want to know how your investment manager is doing in managing your portfolio? It’s harder than it seems.
You can take your quarterly or annual returns and compare them to publicly available data. Stock market indices, such as the FTSE 100, might be the obvious place to start.
But you’ll quickly find that this doesn’t really work. What really matters in assessing the manager’s performance is judging it against an indicator which has a similar exposure to risk as your selection of stocks and bonds.
In other words, if you have asked your manager to be cautious, you should not be surprised if, in a good year for equities, your portfolio has lagged behind the stock market as a whole.
Similarly, if you mandated your manager to be bold and take bigger risks in the hope of generating greater returns, you should not be shocked if, in a bad year for stocks, you’ve done worse than the market. That’s what risk management is about. It’s what you pay for in hiring the manager in the first place.
Of course, investment managers prepare various sets of figures to share with clients. These often compare a portfolio against selected indices or a model portfolio with a similar risk/reward balance.
But it’s often hard to be sure that you have been given a fair picture. Managers tend to promote good performance periods and downplay the poor. For example, a manager who has done well over three years but badly over one, may headline the longer-term number and bury the 12-month performance. Or they might look for an index that flatters their own results in some way.
Savvy investors can unpick a lot of this. And calculate whether or not charges are included. But even for savers ready to do the work it is still hard to find accurate independent reference points.
One company that offers to make life easier is ARC, a UK-based consultancy that has long provided comparative data to investment managers. ARC gathers information from 119 investment managers running no fewer than 300,000 private client portfolios together worth some £1.5tn. It’s mainly British money invested in pounds sterling.
ARC is this year seeking to draw more retail investors to look at the data via its website and a free app. The company hopes to profit by increasing its visibility in the market and so winning more business from investment management companies.
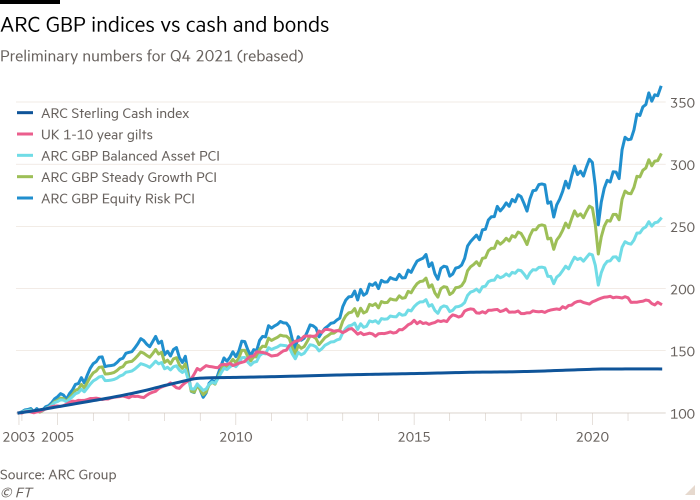
ARC has shared with FT Money preliminary figures for 2021, which class Sterling-based investment portfolios in four groups according to risk — Cautious, Balanced Asset, Steady Growth and Equity Risk. The categorisation is not based on portfolio composition (the percentages of stocks, bonds and cash) but on past volatility compared to general equity volatility.
Not surprisingly, the risk-on investments did well last year given the overall rise in equity markets. On ARC’s figures, Equity Risk managers returned 12.5 per cent, ahead of Steady Growth on 10.5 per cent, Balanced Asset on 7.8 per cent and Cautious on 4.3 per cent (all net of annual charges and commissions).
Given the fair winds blowing through markets over the past decade, risk-on has been a winning approach over five and 10 years as well, as the table shows.
What’s more interesting, in a way, is the light shone on the differences between managers within the same group. ARC data shows in the Steady Growth group, the largest category in terms of portfolios, a manager on the 75 percentile — an upper-middle level performer doing better than three-quarters of their peers — made cumulative returns of 110.0 per cent over 10 years. This compares to 91.7 per cent for a rival on the 25th percentile, a lower-middle level performer. That’s a gap of more than 18 per cent.

Even in the Cautious group, where managers take fewer risks, the gap was 11 percentage points — 53 per cent versus 42 per cent. For Balanced Assets it was 14 per cent and for high-risk Equity Risk 16.4 per cent.
Are the top managers consistently the best? This is an age-old question in investment management. The traditional fund management industry is based on the premise that a good manager can beat the market. Meanwhile, the industry’s critics have long said that success in active management is largely a matter of luck. Better take a passive approach and save on fees.
ARC suggests that there is still hope for the active manager. It says: “Whilst almost all currently top-quartile managers have had periods of underperformance versus their peers, top-quartile managers have tended to spend more than half the time in the top quartile. That general result is mirrored for bottom-quartile managers.”
Unfortunately, for investors, ARC keeps the names and results of individual managers secret. It shares only the collective data with the industry and investors. So you can’t use it to identify the top firm and switch your funds. But you can use it to check your investment manager’s performance — and your own.
Stefan Wagstyl is editor of FT Money and FT Wealth. Email:stefan.wagstyl@ft.com. Twitter:@stefanwagstyl
[ad_2]
Source link

